FX Friday Global Currency Review & Forecast For 8-12-16
Declining Worker Productivity Contradicts Robust Economy Narrative
The solid non farm payroll, unemployment and Job Openings and Labor Turnover Survey (JOLTS) numbers emanating from the U.S. Bureau of Labor Statistics are presenting a stark contrast to other economic data that show a sluggish economy. For example, earlier this week non-farm labor productivity data from the U.S. Department of Labor showed the goods and services produced by U.S. workers per hour fell 0.5% in the second quarter.
While hiring may be on the upswing, the workers being hired are not being productive.
There could be many explanations for the decline in productivity, including an influx of part-time, unskilled workers into the labor force that requires added layers of management resulting in lower productivity. Higher turnover in part time work could also account for the lower productivity. Irrespective of the reason for lower productivity, more important is that the measure of U.S. worker productivity has declined three quarters in a row, the worst stretch since 1979.
Because the markets understand that the Federal Reserve places a heavy emphasis on job numbers as a basis for their interest rate decisions, the Dollar Index* has risen in a knew jerk reaction recently when positive labor market data is released. Conversely as the Dollar Index has risen on seemingly good job numbers, gold and silver have fallen. The post job number rallies in the dollar have been erased with a couple of days of their release as have the declines in the prices of gold and silver.
Market participants appear to be realizing that strong job numbers in absence of other compelling strong economic data, are most likely not enough for the Federal Reserve to embark on even a gradual path of interest rate hikes
Gold and Silver
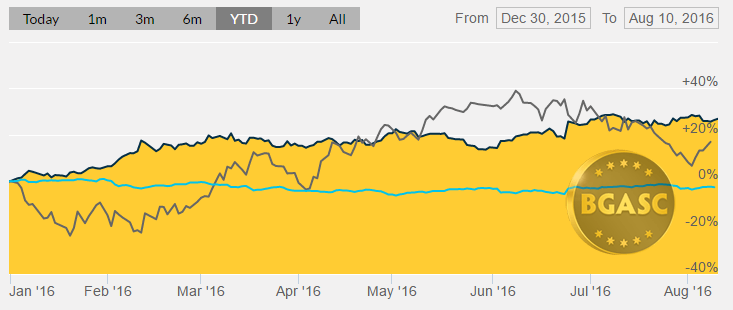
Gold has risen more than $200 an ounce in 2016 or more than 30% and has traded over $1300 an ounce since the end of June. Recent set backs in the price of gold have been short lived and gold has continued to consolidate its gains.
Year to Date Dollar Index, Oil and Gold Prices
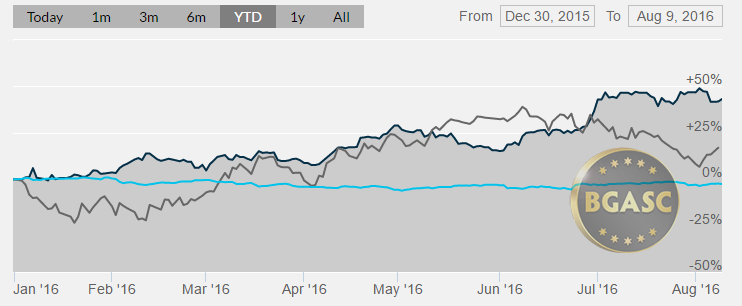
Silver has shown surprising strength in the $20 an ounce range. Silver been the best performing asset in 2016, rising well over 40% in 2016. The price of silver has held over $20 an ounce during the month of July and has moved in and out of that range in August. The price of silver is at its highest levels in two years.
Year to Date Dollar Index, Oil and Silver Prices
British Pound
Ever since the Brexit vote the British pound has suffered. The British Pound reached its high of the year at around $1.50 prior to the Brexit vote then fell to around $1.30 after the vote and has remained depressed due to nagging fears of the implications of Brexit and the reduction of interest rates by the Bank of England.
Oil
Oil has fallen from its highs of 2016. The price of oil has sharply declined on news of building oil stockpiles and the potential of an oil glut. Saudi Arabia informed OPEC this week that its oil out put had reached all time highs in July. Oil is now closer to $40 a barrel than $50 a barrel where it was just two months ago.
What’s next?
Next week will provide some information on the inflation front when the consumer price index is released. Housing starts and industrial productions will provide further clues on the health of the economy. The Fed meeting minutes will be scrutinized for any hints into the Fed’s thinking on raising interest rates in 2016.
Here are some economic reports that could impact gold, silver and currency movements next week:
Aug 15 Empire Manufacturing Aug
Aug 15 NAHB Housing Market Index Aug
Aug 15 Net Long-Term TIC Flows Jun
Aug 16 Building Permits Jul
Aug 16 Core CPI Jul
Aug 16 CPI Jul
Aug 16 Housing Starts Jul
Aug 16 Capacity Utilization Jul
Aug 16 Industrial Production Jul
Aug 17 MBA Mortgage Index 08/13
Aug 17 Crude Inventories 08/13
Aug 17 FOMC Minute Jul 27
Aug 18 Initial Claims 08/13
Aug 18 Continuing Claims 08/06
Aug 18 Philadelphia Fed Aug
Aug 18 Leading Indicators July
Aug 18 Natural Gas Inventories 08/13
* The US Dollar Index tracks the US dollar vs. the Euro, the Japanese Yen, the British Pound, the Canadian Dollar, the Swedish Krona and the Swiss Franc. The Euro comprises nearly 58% of the index.
This article by BGASC is not, and should not be regarded as, investment advice or as a recommendation regarding any particular course of action.