Gold Mining Update
Gold Mining Company Shares Spike in 2016
After years of significant underperformance, gold mining companies have snapped back to life in 2016. The Market Vectors Gold Miners ETF (GDX) that tracks a basket of gold miners closed at $18.39 on Friday, February 19, 2016, up 48% from its low of $12.49 on January 19, 2016.
The Market Vectors Junior Gold Miners ETF (GDXJ) that tracks a basket of junior gold miners closed at $24.39 on Friday, February 19, 2016, up 43% from its low of $17.09 on January 19, 2016.
The New York Stock Exchange Basket of Unhedged Gold Stocks – The Gold Bug Index (HUI) is up 41% this year.
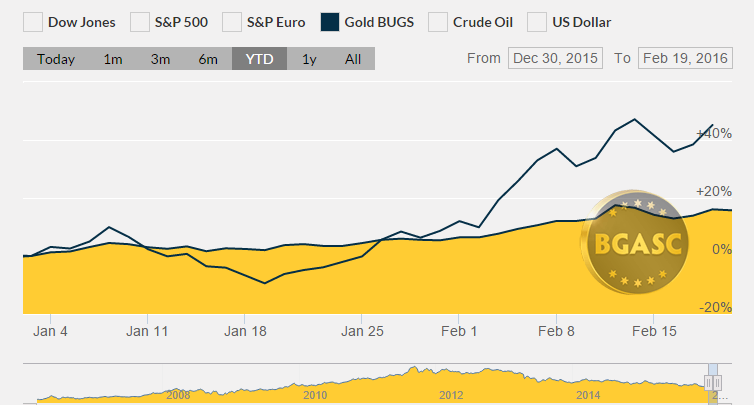
Gold mining stock prices through mid February 2016, have out paced gold bullion’s 15% rise year to date by a wide margin.
While the gains of the gold miners in 2016 are impressive, keep in mind:
Friday’s GDX price of $18.39 is down 71% from its all time high of $62.80 on July 31, 2011.
Friday’s GDXJ price of $24.36 is down 86% from its high of $171.84 on November 10, 2010.
Gold bullion is down from its high of $1911 an ounce in 2011 to $1226 an ounce or “just” 36%.
While the Gold Miners have out performed gold bullion in 2016,
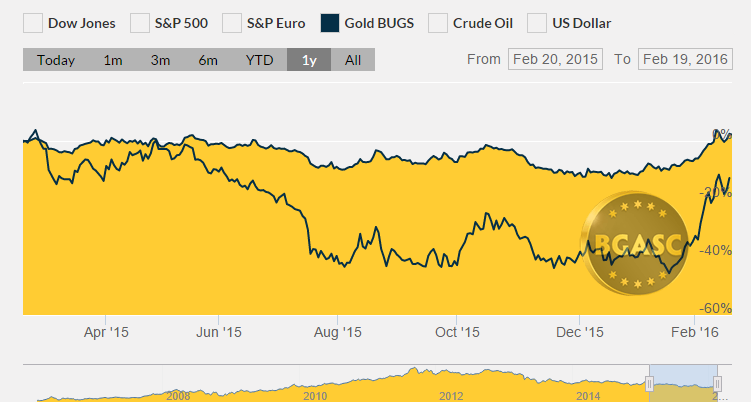
…they have underperformed gold the past twelve months
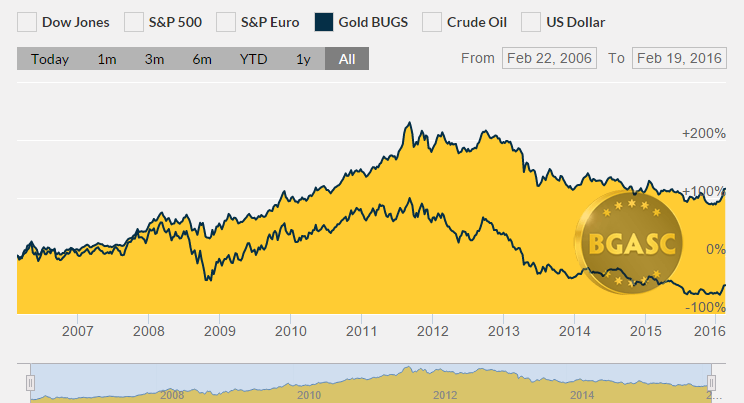
…and have massively underperformed gold the past ten years
Gold Supply and Demand
Supply
Like silver mining production, some market analysts believe that after years of increasing gold mining production in spite of decreasing prices, global gold mining production will be down in 2016.
In July 2015, The World Gold Council reported “While, in recent years, production has risen to over 3,000 tonnes, this trend is unlikely to continue for much longer as a range of factors, including cost pressures, lack of substantial discoveries and a reduced project pipeline will likely see production revert to its longer term levels.”
In February 2016, the World Gold council noted annual mine production increased by just 1% in 2015 – the slowest rate since 2008 and that total gold supply declined 4%.
Demand
Analysts are mixed on gold demand projections for 2016 with some suggesting strong demand from the world’s two largest gold consuming nations, China and India, with other projecting a falling off of demand.
Goldcorp Inc 10.0%, Barrick Gold Corp 8.6%,Newmont Mining Corp 7.5%, Newcrest Mining Ltd 5.6%, Randgold Resources 5.3%, Agnico Eagle Mines 5.3%, Franco-Nevada Corp 4.9%, Silver Wheaton Corp 4.5%, AngloGold Ashanti Ltd 4.2%, Royal Gold Inc 4.2%, Yamana Gold Inc 3.6%, Eldorado Gold Corp 3.4%, Gold Fields Ltd 3.2%, Kinross Gold Corp 3.1%, Sibanye Gold Ltd 2.1%, New Gold Inc 1.9%, B2Gold Corp 1.6%, Pan American Silver Corp 1.5%, Detour Gold Corp 1.4%, Hecla Mining Co 1.2%, Centerra Gold Inc 1.2%, Centamin PLC 1.1%, Rio Alto Mining Ltd 1.0%, Harmony Gold Mining Co Ltd 0.9%, AuRico Gold Inc 0.8%, IAMGOLD Corp 0.8%, SEMAFO Inc 0.8%, Alamos Gold Inc 0.8%, First Majestic Silver Corp 0.7%, Alacer Gold Corp 0.6%, Coeur Mining Inc 0.6%, Primero Mining Corp 0.5%
Oceanagold 9.86%, Northern Star Resources Ltd 5.71%, Pan American Silver 5.48%, Osisko Gold Royalties Ltd 5.46%, Evolution Mining Ltd 5.13%, Torex Gold Resources 5.00%, Semafo 4.90%, Alamos Gold 4.87%, Iamgold 4.56%, Novagold Resources 4.49%, Centamin Plc 4.33%, B2gold 3.90%, Lake Shore Gold 3.79%, Hecla Mining Co.3.71%, Harmony Gold Mining Co Ltd 3.66%, First Majestic Silver 3.62%, Endeavour Mining 3.27%, China Gold International Resources 2.99%, Regis Resources Ltd 2.98%, Alacer Gold 2.70%, Pretium Resources 2.59%, Silver Standard Resources 2.37%, Premier Gold Mines Ltd 2.35%,,Kirkland Lake Gold 2.28%, Guyana Goldfields 2.19%, Asanko Gold 2.17%, Mag Silver 2.17%, Coeur Mining 2.11%, Fortuna Silver Mines 2.06%, G-resources Group Ltd 1.96%, Seabridge Gold 1.82%, Mcewen Mining 1.74%, Saracen Mineral Holdings Ltd 1.72%, Sandstorm Gold Ltd 1.69%, Koza Altin Isletmeleri 1.05%, Silvercorp Metals 1.01%, Endeavour Silver 0.92%,Teranga Gold 0.90%, Argonaut Gold 0.88%, Primero Mining 0.87%, Continental Gold 0.64%, China Precious Metal Resources Holdings 0.59%, Highland Gold Mining Ltd 0.49%, Resolute Mining Ltd 0.49%, Gold Resource 0.48%,,Beadell Resources Ltd 0.46%, Dundee Precious Metals 0.44%, Kingsgate Consolidated Ltd 0.24%, Patagonia Gold Plc 0.09% Sulliden Mining Capital 0.07%, Paramount Gold Nevada 0.01%, Real Gold Mining Ltd 0.00%
Barrick Gold 16.49%, Goldcorp 16.20%, Newmont Mining 9.89%, Agnico Eagle Mines 4.61%, Compañia de Mínas Buenaventura 4.50%, Sibanye Gold Limited 4.47%, AngloGold Ashanti 4.25%, Randgold Resources 4.09%, Kinross Gold 4.05%, B2Gold Corp. 3.97%, AuRico Gold 3.95%, Yamana Gold 3.93%, Eldorado Gold Corp 3.91%, New Gold Inc 3.84%, Alamos Gold Inc. 3.51%, Harmony Gold Mining 3.30%, Gold Fields Limited 3.22%, Iamgoldcorp 3.12%
The foregoing is not a recommendation to buy the stock of any particular gold mining company or the shares of gold miners in general. The list of gold miners in the GDX, GDXJ and HUI above were taken from third party sources and are presented for informational purposes only; as such BGASC does not take responsibility for the completeness or accurracy of those lists.
All Blog Articles are provided by a third party and do not necessarily reflect the explicit views of BGASC, nor should they be construed as financial advice.