US Mint Gold Sales Out of Step With Global Gold Demand
U.S. Mint gold sales slow to a crawl while Perth and Canadian Mints and Chinese and Indian and demand remain robust.
Retail sales of gold in 2016 in the first half of the year were one of the strongest over the last five years. The stock market took a nose dive in January 2016, and Brexit vote scheduled for June that year created much uncertainty in the financial markets. Retail gold demand surged in the first half of 2016 at the three large sovereign mints, the US. Perth and Canadian Mints.
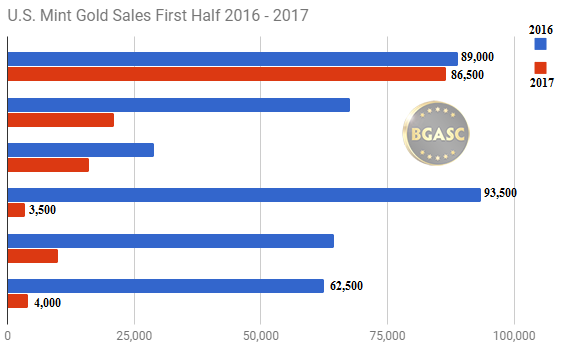
The United States Mint is the largest of the three sovereign mints and its gold sales generally out sell the other two mints by a wide margin. In the first half of 2017, however, each of the Perth and Canadian Mints have out sold the U.S. Mint by a wide margin.
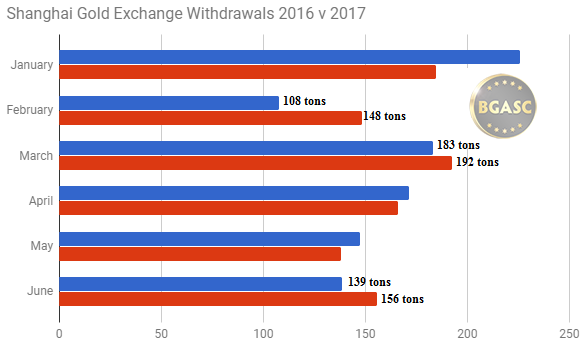
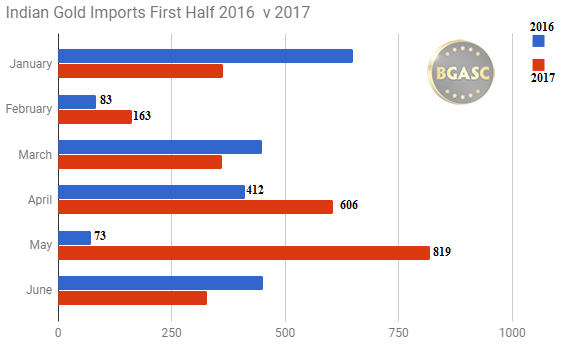
Chinese gold demand as measured by gold withdrawals on the Shanghai Gold Exchange was strong in 2016, while Indian gold imports were down about 60% in 2016 from 2015’s near record imports.
2017 opened the year with continued robust gold sales at each of the three largest mints. Shanghai gold demand withdrawals and Indian gold imports also opened 2017 strong. In February, however, the U.S. Mint posted lower year over year monthly sales of one ounce American Gold Eagle coins. From February to June 2017 U.S. Mint American Gold Eagle sales are down 83% as compared to February to June 2016 sales! (see chart below)
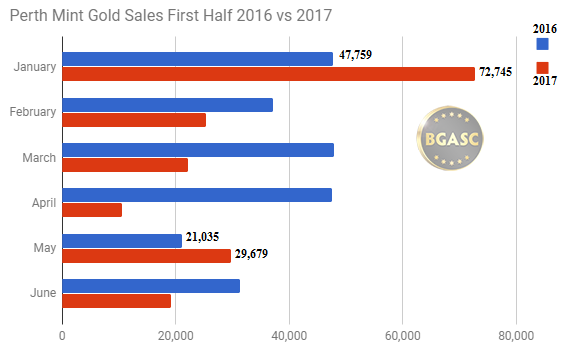
While the Perth and Canadian Mints have seen decline in gold sales the first half of 2017, with declines of 23% and 35%, respectively, such decreases in sales are readily explainable. Gold sales were very strong in the first half of 2016, so a decline from elevated sales can be expected. The U.S. Mint’s 83% decline however can not be so easily explained.
Here is an overview of gold sales and demand in the first half of 2017 compared to 2017.
Perth Mint Gold Sales
Buy Perth Mint Gold Coins at BGASC.com
Canadian Mint Gold Sales
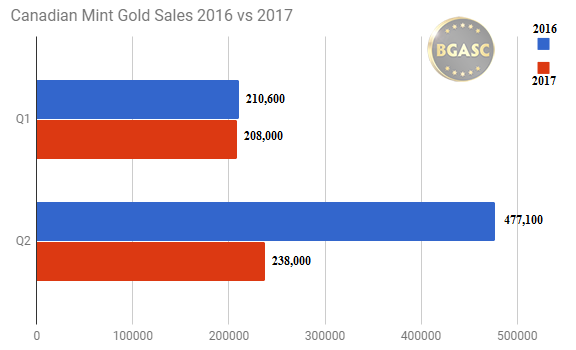
The Canadian Mint has shifted some of their focus away from gold bullion sales towards numismatic coins with varying designs. Sales of such coins increased 29% in the second quarter of 2017 vs the second quarter of 2016.
Buy Canadian Mint gold from BGASC.com
Shanghai Gold Exchange Withdrawals
Buy Chinese Gold Pandas from BGASC.com
Indian Gold Imports
Buy Tola Gold Bars from BGASC.com
US. Mint Gold Sales
Buy American Gold Eagle coins from BGASC.com
This article by BGASC is not, and should not be regarded as, investment advice or as a recommendation regarding any particular course of action.