FX Friday Global Currency Review & Forecast For 10-07-16
Week Ends With a British Pound Flash Crash & a Non Farm Payroll Miss.
The Dollar Index* rose all week on continued Fed insistence that a rate hike was on the table in 2016. Most market participants factored in a rate hike at the December meeting. As the Dollar strengthened, gold, silver and foreign currencies fell.
The British Pound fell below $1.31 and was subjected to a flash crash on Thursday evening that dropped the pound about ten percent in a matter of minutes, pushing the pound below $1.20 and as low as $1.13.
Gold and silver fell 5 and 12 percent, respectively from Monday to Thursday on no particular news, other than the normal Fed chatter threatening rate hikes.
Friday morning, the Bureau of Labor Statistics released its non-farm payroll number for September showing that 156,000 jobs were created vs. an expectation of 176,000. The unemployment rate rose to 5.0%. The Fed pays particular attention to the non-farm labor number as a major determinant in its consideration whether to raise interest rates. A higher non-farm payroll number increases the likelihood that the Fed will raise rates, a lower one decreases the odds.
Despite the non farm payroll miss, Cleveland Fed President Mester who has been a vocerferous advocate for rate hikes and voted for a rate hike at the September Fed meeting, called the non- farm payroll number ‘solid’.
The non farm payroll miss caused an immediate reaction in the Dollar Index and the prices of gold and silver on Friday morning. Gold and silver rose modestly about .25 and 1%, respectively but remained well off their Monday highs. The Dollar Index fell about .40% early Friday morning but was still up over 1% on the week.
The vast majority of surveyed market participants do not expect a rate hike at the November meeting. Market participants remain mixed regarding the possibility of a rate hike at the Fed’s December meeting, although the probability fell after the release of the non farm payroll number.
Gold and Silver
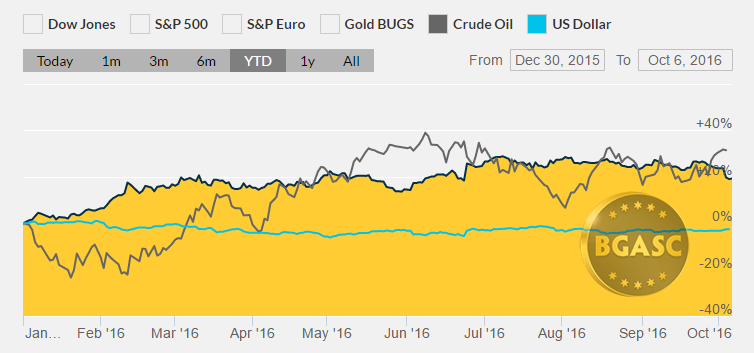
Gold rose immediately prior to and after the Fed September meeting. Gold has traded in a range between $1308-1350 in September, further consolidating it gains from earlier in the year. Gold held, however, above $1,300 an ounce all of August and September. Gold broke to the upside from the low end of its September trading range following the Fed’s September 20-21 meeting. Gold ended last week at $1322 an ounce. This week, gold lost $75 an ounce and retraced only a small amount of its losses on Friday morning. Gold was trading at $1258 an ounce Friday morning.
Year to Date Dollar Index, Oil and Gold Prices

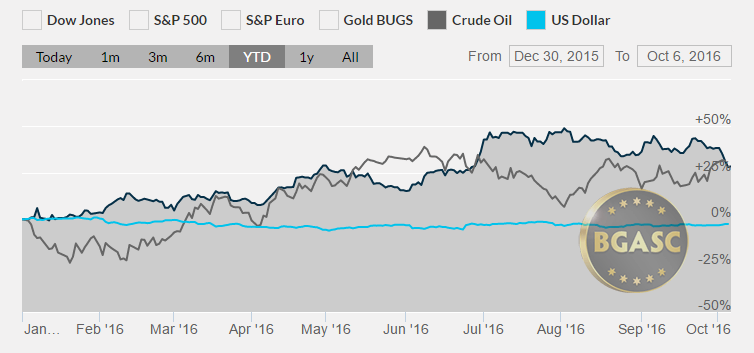
Silver also popped after the September Fed meeting and touched briefly over $20 an ounce. Profit taking and rate hike talk had pushed silver down below $19.00 an ounce last week. This week silver lost 12% after rising significantly last week. The losses in silver were the worst percentage losses in a week since 2013. The price of silver is near its highest levels in two years, but far below its all time high of $50 an ounce reached in April 2011.
Year to Date Dollar Index, Oil and Silver Prices

Oil
Oil continued to shoot higher this week as a result of OPEC’s decision to cut production. Oil rose the first six months of 2016. Since then, oil had been trading on news of stockpiles and the possibility of output freeze talks. During the past few months, oil traded in the low $40 range, spiking and falling on inventory reports and from talks about upcoming meetings among oil producers to discuss output freezes or cuts. The OPEC decision to cut output last week has pushed oil back to over $50 a barrel.
What’s next?
The Presidential campaign will continue to dominate market participants’ attention. Fed statements regarding the state of the US economy in light of the non farm payroll miss will also be closely watched.
Here are some economic reports that could impact gold, silver and currency movements next week:
Oct 12 MBA Mortgage Index 10/08
Oct 12 Crude Inventories 10/08
Oct 12 FOMC Minutes Sep 21
Oct 13 Initial Claims 10/08
Oct 13 Continuing Claims 10/01
Oct 13 Export Prices ex-ag. Sep
Oct 13 Import Prices ex-oil Sep –
Oct 13 Natural Gas Inventories 10/08
Oct 13 Treasury Budget Sep
Oct 14 PPI Sep
Oct 14 Core PPI Sep
Oct 14 Retail Sales Sep
Oct 14 Retail Sales ex-auto Sep
Oct 14 Business Inventories Aug
Oct 14 Mich Sentiment Oct
* The US Dollar Index tracks the US dollar vs. the Euro, the Japanese Yen, the British Pound, the Canadian Dollar, the Swedish Krona and the Swiss Franc. The Euro comprises nearly 58% of the index.
This article by BGASC is not, and should not be regarded as, investment advice or as a recommendation regarding any particular course of action.
