FX Friday Global Currency Review & Forecast For 8-19-16
Fed Talk of Rate Hikes Back on the Table
The Federal Reserve is publically talking about rate hikes again, and soon. Earlier this week, Fed Presidents Dudley and Lockhart woke market participants from their slumber with calls of “possible” rate hikes in 2016, the earliest which could come in September. The pronouncements immediately boosted the Dollar Index* which had dropped below 95, pushed the stock markets down and knocked back gold and silver.
On Wednesday, the Fed released the minutes from its July 26-27 meeting. The minutes indicated that most of the Fed members are still in a wait and see mode with respect to removing monetary accommodation and raising interest rates. The Fed was encouraged by recent consumer spending numbers and the “brisk” increase in recent non farm payroll number and unemployment reading of 4.9%. The Fed, however, took pause about the slowing pace business spending and growth in the housing market.
The Fed concluded that with inflation running below their 2% inflation target “to wait for additional information that would allow them to evaluate the underlying momentum in economic activity and the labor market and whether inflation was continuing to rise gradually to 2 percent as expected.”
On release of the Fed minutes the Dollar Index gave up the gains from the rate hike threats of Messrs. Lockart and Dudley earlier in the week. Gold and silver rebounded and retraced some of their losses from the Fed Presidents’ statements on raising rates.
Gold and Silver
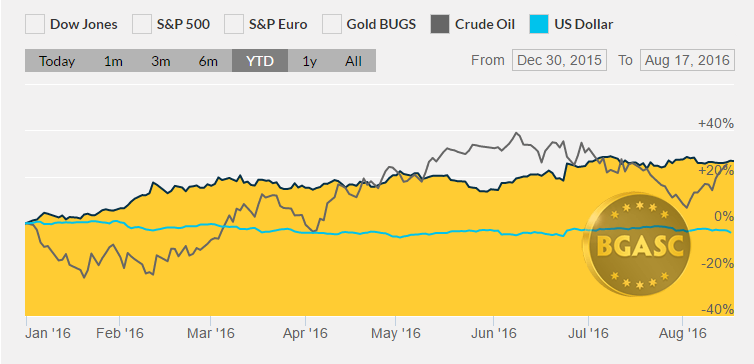
Gold has consolidated its gains in the $1325-1350 an ounce range over the past few weeks after rising more than $200 an ounce in 2016. Recent set backs in the price of gold have been short lived. Recent Fed pronouncements on potential rate hikes seem to have inflicted only temporary damage on the price of gold.
Year to Date Dollar Index, Oil and Gold Prices

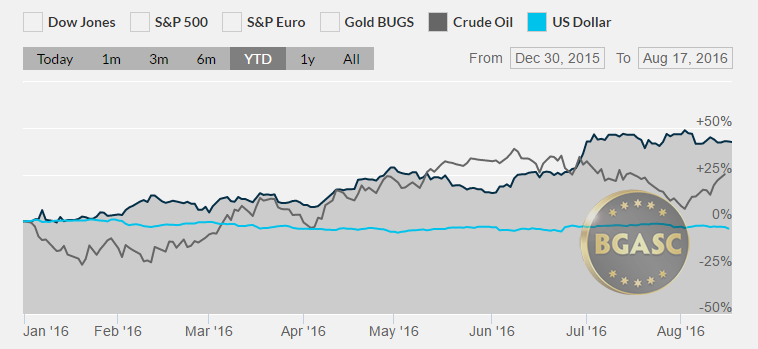
Silver has pulled back below $20 an ounce after holding gains above that threshold. Despite the recent pull back, silver been the best performing asset in 2016, rising well over 40% in 2016. The price of silver is at its highest levels in two years, but far below its all time higher of $50 an ounce reached in April 2011.
Year to Date Dollar Index, Oil and Silver Prices

British Pound
The British Pound has been on a downward trajectory ever since the Brexit vote. The British Pound reached its high of the year at around $1.50 prior to the Brexit vote then fell to around $1.30 after the vote and has remained depressed due to nagging fears of the implications of Brexit and the reduction of interest rates by the Bank of England.
Oil
Oil has been swinging back in forth in the mid $40 dollar a barrel range the past few weeks. Oil has fallen from its highs of 2016. The price of oil has sharply declined on news of building oil stockpiles and the potential of an oil glut. Saudi Arabia informed OPEC this week that its oil output had reached all time highs in July. Talks of an upcoming meeting among oil producers to discuss and output freeze has helped boost the price of oil.
What’s next?
Next week’s durable goods number should provide further details on the strength of the underlying economy. The second revision of the second quarter GDP is also on deck. An upward revision from the original estimate of 1.2% would surprise the markets. A GDP reading at or below 1.2% might give the Fed further pause on raising interest rates, although many Fed members are on record as predicting stronger second half GDP.
Here are some economic reports that could impact gold, silver and currency movements next week:
Aug 23 New Home Sales Jul
Aug 24 MBA Mortgage Index 08/20
Aug 24 FHFA Housing Price Index Jun
Aug 24 Existing Home Sales Jul
Aug 24 Crude Inventories 08/20
Aug 25 Initial Claims 08/20
Aug 25 Continuing Claims 08/13
Aug 25 Durable Orders Jul
Aug 25 Durable Orders/Ex-Trans. Jul
Aug 25 Natural Gas Inventories 08/20
Aug 26 GDP – Second Estimate Q2
Aug 26 GDP Deflator/2ndEstimate Q2
Aug 26 Int. Trade in Goods Jul
Aug 26 Michigan Sentiment Aug
* The US Dollar Index tracks the US dollar vs. the Euro, the Japanese Yen, the British Pound, the Canadian Dollar, the Swedish Krona and the Swiss Franc. The Euro comprises nearly 58% of the index.
This article by BGASC is not, and should not be regarded as, investment advice or as a recommendation regarding any particular course of action.
