FX Friday Global Currency Review & Forecast For 8-26-16
Federal Reserve at Center of Attention Again
Having been ignored for a few weeks, the Fed is back at the center of attention. Fed Presidents Dudley, Williams and Lockhart have indicated they favor rate hikes this year, perhaps as soon as September. The trio’s call for rate hike mirror the Fed Presidents calls for a rate hike in June that never materialized. It seems if the market discounts the Fed’s calls for rate hikes and the Dollar Index falls too much, Fed officials feel obliged to remind market participants that they are still relevant and can raise interest rates as soon as the next meeting.
As a result of renewed Fed talk of rate hikes, Fed Chair Janet Yellen’s speech today will be closely scrutinized for hints as to the direction of Fed interest rate policy. The Dollar Index* has responded to the perceived threat of an interest rate hike or two in 2016 by rising this week.
We probably will not get specific guidance on the direction of rate hikes from Ms. Yellen today. In the past, ambivalent pronouncements by MS. Yellen regarding the direction of rate hikes following hawkish statements by her Fed colleagues has led market participants to anticipate rate hikes. This time, however, market participants will need Ms. Yellen to give a strong signal that a rate hike is coming in September in order for them to anticipate a rate hike, as the Fed has only raised interest rates once in over ten years, despite talking about multiple rate hikes for years.
Gold and Silver
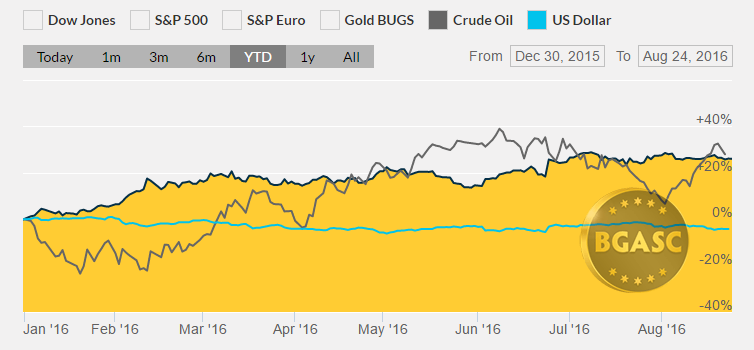
Gold had consolidated its gains in the $1325-1350 an ounce range over the past few weeks after rising more than $200 an ounce in 2016. Earlier this week, gold fell below $1325 as interest rate concerns pulled gold down. Recent set backs in the price of gold have been short lived, but the period between now and the September 20-21 Fed meeting may weigh further on gold.
Year to Date Dollar Index, Oil and Gold Prices

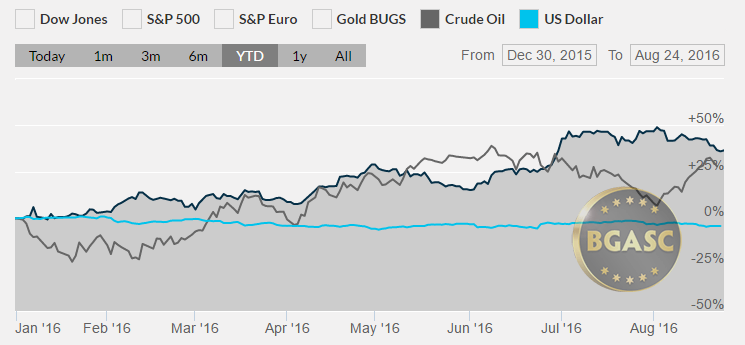
Silver has fallen below $19 an ounce after holding gains above $20 in late July early August. Despite the recent pull back, silver been the best performing asset in 2016, rising well over 40% in 2016. The price of silver is at its highest levels in two years, but far below its all time higher of $50 an ounce reached in April 2011. The price action in silver highlights that when silver falls, it falls harder than gold.
Year to Date Dollar Index, Oil and Silver Prices

British Pound
The British Pound has shown some signs of life recently as the predictions of gloom and doom after the Brexit vote have yet to materialize. The British Pound hit a three week high earlier this week after having been on a downward trajectory ever since the Brexit vote. The British Pound reached its high of the year at around $1.50 prior to the Brexit vote then fell to around $1.30 after the vote and had remained depressed due to nagging fears of the implications of Brexit and the reduction of interest rates by the Bank of England. Earlier this week the British Pound increased to $1.33.
Oil
Oil has been stuck in the mid $40 dollar a barrel range the past few weeks. Earlier this week, oil fell on a report that United States oil stockpiles had unexpectedly increased. With Saudi Arabia’s oil output at all time highs, oil has had difficulty holding onto any gains it gets from talks about upcoming meetings among oil producers to discuss an output freeze.
What’s next?
All eyes will be on Janet Yellen later today as she speaks at the Jackson Hole conference. Next week’s personal income numbers and Friday’s non farm payroll report will be among some of the most important data the Fed will get before its September 20-21 meeting.
Here are some economic reports that could impact gold, silver and currency movements next week:
Aug 29 Personal Income Jul
Aug 29 Personal Spending Jul
Aug 29 Core PCE Prices Jul
Aug 30 Case-Shiller Index Jun
Aug 30 Consumer Confidence Aug
Aug 31 MBA Mortgage Index 08/27
Aug 31 ADP Employment Change Aug
Aug 31 Chicago PMI Aug
Aug 31 Pending Home Sales Jul
Aug 31 Crude Inventories 08/27
Sep 1 Challenger Job Cuts Aug
Sep 1 Initial Claims 08/27
Sep 1 Continuing Claims 08/20
Sep 1 Productivity-Rev. Q2
Sep 1 Unit Labor Costs-Rev Q2
Sep 1 Construction Spending Jul
Sep 1 ISM Index Aug
Sep 1 Natural Gas Inventories 08/27
Sep 1 Auto Sales Aug
Sep 1 Truck Sales Aug
Sep 2 Nonfarm Payrolls Aug
Sep 2 Nonfarm Private Payrolls Aug
Sep 2 Unemployment Rate Aug
Sep 2 Hourly Earnings Aug
Sep 2 Average Workweek Aug
Sep 2 Trade Balance Jul
Sep 2 Factory Orders Jul
* The US Dollar Index tracks the US dollar vs. the Euro, the Japanese Yen, the British Pound, the Canadian Dollar, the Swedish Krona and the Swiss Franc. The Euro comprises nearly 58% of the index.
This article by BGASC is not, and should not be regarded as, investment advice or as a recommendation regarding any particular course of action.
