Silver An Industrial Metal
Silver as an Industrial Metal
Industrial Uses for Silver
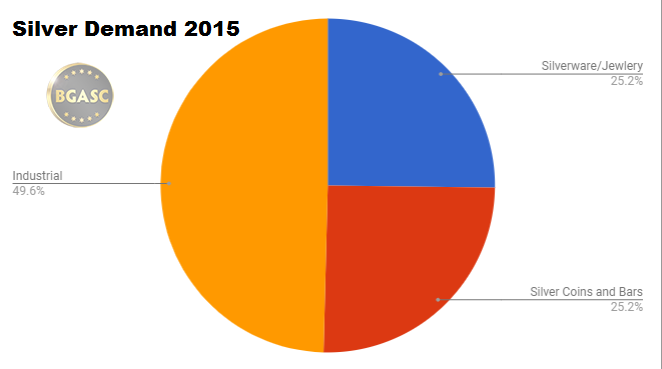
In 2015, industrial demand for silver was 569.9 million ounces. Industrial uses for silver include electronics manufacturing and solar panel production. In 2015, silver demand for jewelry and silverware was about 290 million ounces and overall silver demand in 2015 was approximately 1150 million ounces.
2015 – A Record Year For Silver Coins Rounds and Bars Drives Overall Silver Demand
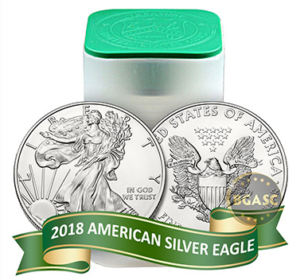
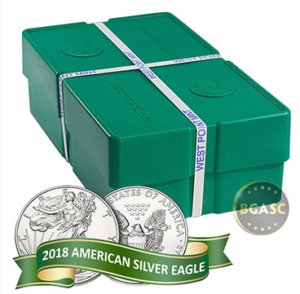
The bulk of remaining silver demand in 2015 came from sales of sovereign minted silver coins and privately minted silver rounds and bars. In 2015 sales of one ounce American Silver Eagle (ASE) and one ounce Canadian Silver Maple Leaf (SML) coins hit records. The U.S. Mint reported selling 47 million ASEs and the Canadian Mint reported selling 40 million SMLs in 2015. According to the Silver Institute, total sales of sovereign silver coin sales like ASEs, SMLs, Australian Silver Kangaroos, Austrian Silver Philharmonics, Mexican Silver Libertads along with privately minted silver rounds and bars topped 290 million ounces that year.
While 2015 was a record year for sales of sovereign silver coins and silver bars, industrial demand for silver was solid but not spectacular.
Much of the demand for silver coins, rounds and bars was driven by the multi-year low silver prices that year.
The average price of silver in 2015 was $15.68 and hit a low of $13.71 in December 2015.
Soaring silver coin, round and bar demand, drove that demand to 25% of overall silver demand in 2015 and industrial silver demand just below 50%.
2017 – Gains in Industrial Silver Demand Push overall Demand over 1,000 million ounces.
In 2017, just two years after silver demand for silver coins, rounds and bars hit a record, demand fell about 55% to approximately 130 million ounces. Industrial demand for silver in 2017, however, rose to over 599 million ounces or 5.1% and silver demand for jewelry and silverware was about 270 million ounces, up about 6% from 2016 but down about 7% from 2015.
Overall silver demand in 2015 was approximately 1,000 million or one billion ounces.
Overall demand for silver including silver coins, rounds and bars, industrial, jewelry and silverware was
Silver’s Industrial Price Support
Rising prices may have put a dent in silver coin round and bar demand in 2017, but an improving economy boosted industrial demand which is fairly price insensitive.
Silver investors also tend to buy when the price is moving decidedly in either direction. Prices were falling steadily all through 2015, having peaked in January 2015 at $18.22 and eventually fell to $13.71 or about 25%!
The average price of silver in 2017 was $17.04 an ounce. The price of silver was range bound during 2017 trading more than 90% of the year with either $16 or $17 handle with a range of $15.22-$18.56. The lack of price movement seems to have curbed investor demand for silver coins, rounds and bars.
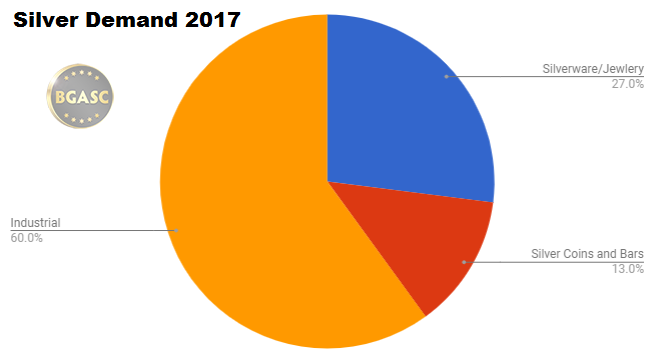
Silver coin, round and bar demand fell to just 13% in 2017 and industrial demand rose to 60% of overall demand.
2018 Outlook
The price of silver in 2018 has been range bound through the first three and a half months. Indeed, the price of silver has traded in an even tighter range in 2018 ($16.20-$17.82) than in 2017 and not surprisingly, American Silver Eagle sales are lower during the comparable time period in 2017.
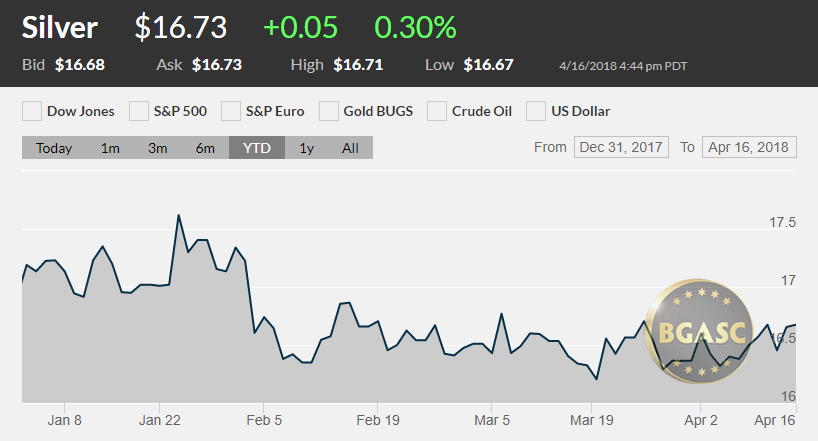
Seems, silver coin, round and bar purchasers like to buy to catch a price wave higher or to get a bargain as prices fall, but sit tight when the price does the same.
According to Thomson Reuters’ GFMS, silver investment demand is expected to grow for the third year in a row in 2018 driven by the electronics and solar industries.
This article by BGASC is not, and should not be regarded as, investment advice or as a recommendation regarding any particular course of action.
